The VC Myth, Debunked: Why Patent Funders Aren’t VCs
Reading Sean K. Thompson’s new preprint — and what the publicly disclosed Burford and Omni Bridgeway data actually say about how patent funders make money.
The Setup
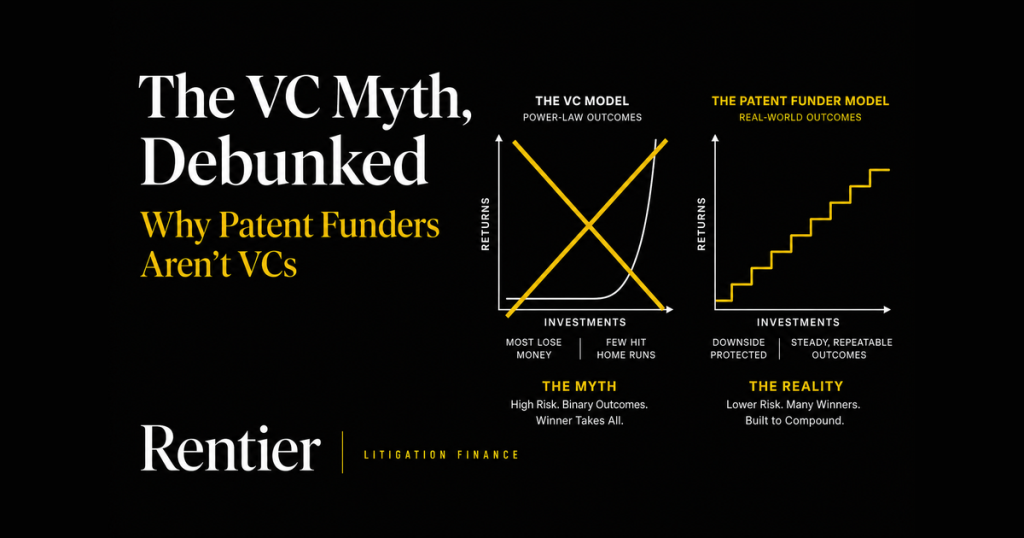
In 2025, four WilmerHale attorneys published The Venture Capital Model Applied to Litigation Funding: Misaligned Incentives and the Harm to Innovation in volume 26 of The Sedona Conference Journal. Their central claim: patent litigation funders operate on a “venture capital model” — financing “a high number of lawsuits—many of questionable merit—based on the chance that a small number may succeed and result in large damages awards.” They estimate funders expect 50–70% of investments to fail, accepting that loss rate because the occasional outsized winner is supposed to carry the fund. From there, the article proposes mandatory funder disclosure, enhanced fee-shifting, and other reforms.
On May 14, 2026, Sean K. Thompson (Managing Director — IP Investments & General Counsel at Parabellum Capital) released a preprint of his rebuttal: Patent Litigation Finance and the Venture Capital Myth, forthcoming in volume 27 of the same journal. It’s a 41-page methodical takedown — and the math in it is unusually clean.
Both publications are public. Thompson’s is released under CC BY-NC 4.0; the Summersgill et al. article is hosted on Sedona Conference’s site and mirrored on JDSupra. This post pulls the structural and arithmetic argument out of the preprint and works through the numbers myself, with a few side observations from the perspective of someone who has actually invested in funded patent cases.
And I’ll be honest about my priors going in: I’ve put real money into funded patent cases through a retail platform, and the results were ugly enough that when I first read the “VC model” critique, part of me nodded along — it sounded like what I’d lived. So I came to Thompson’s rebuttal half-expecting to argue with it. I left convinced he’s right about the sophisticated funders, and that my own losses are closer to the exception that proves his rule. I’ll come back to that tension at the end.
The Three Lines of Attack
Thompson organizes the rebuttal around three independent failure points in the “VC model” claim:
- Section I — Evidence. The article that Thompson is rebutting cites a single enforcement campaign and two individual cases. Out of roughly 4,500 funded patent cases since 2022, that’s an exceptionally thin evidentiary base for a market-wide structural claim.
- Section II — Fund mathematics and market structure. Even granting the model, the arithmetic doesn’t pencil. Patent damages don’t have the uncapped equity ceiling that makes high-loss-rate venture portfolios viable.
- Section III — Reported return data. The two largest publicly traded funders disclose return distributions that look nothing like a 50–70% loss-rate portfolio carried by rare 10x+ winners.
The three arguments stack. Even if you grant one, the next two still kill the thesis.
1. The Evidence Is Three Anecdotes
The Summersgill article uses an industry estimate that “30 percent of patent cases are backed by litigation funders.” Combined with ~3,800 patent cases filed annually in federal district court since 2017, that implies roughly 4,500 funded patent cases since 2022. The supporting evidence WilmerHale offers for an industry-wide strategy:
| Example | Status | Lottery-ticket payoff? |
|---|---|---|
| VLSI v. Intel (Fortress) | $2.18B verdict reversed on appeal; campaign ongoing; no money collected from Intel; Fortress created the entity, acquired the patents from NXP, and staffs a majority of the board | No |
| AVM Techs. v. Intel | Jury found non-infringement at trial (2017); no Section 285 fees sought on baselessness grounds; no sanctions | No |
| Akamai v. MediaPointe | Court denied Akamai’s fee motion without oral argument; held the case was not “exceptional” under §285 | No |
Thompson’s observation: “If those are the strongest available supports for the thesis, the universe of cases exhibiting the lottery-ticket payoff mechanism the theory requires is likely scarce or empty.”
VLSI is also a structurally bad exemplar for litigation finance generally — Fortress created the entity, holds the patents, and controls the board. That’s not third-party financing of someone else’s claim; that’s a different business altogether.
2. The Math Doesn’t Pencil
This is the section that does the heavy lifting. Thompson builds a hypothetical fund — “VC LitFi” — that implements exactly the strategy the WilmerHale article describes: 10 single-case patent investments, $10M committed each, with 6 losers, 3 modest winners, and 1 grand slam.
The 9 cases before the grand slam
| Case outcome | Deployed | Recovered | Net |
|---|---|---|---|
| Case 1: Dismissed at pleading stage | $0.5M | $0.0M | −$0.5M |
| Case 2: Claims canceled in IPR | $2.0M | $0.0M | −$2.0M |
| Case 3: Adverse claim construction, settles | $4.0M | $0.5M | −$3.5M |
| Case 4: Early adverse summary judgment | $5.0M | $0.0M | −$5.0M |
| Case 5: Summary judgment on eve of trial | $7.0M | $0.0M | −$7.0M |
| Case 6: Defense verdict, settles | $9.0M | $2.0M | −$7.0M |
| Case 7: Settlement | $8.0M | $10.0M | +$2.0M |
| Case 8: Settlement | $8.5M | $11.9M | +$3.4M |
| Case 9: Settlement | $9.5M | $13.8M | +$4.3M |
| Subtotal (Cases 1–9) | $53.5M | $38.2M | −$15.3M |
Even with three winning settlements averaging ~1.4x MOIC, the fund is $15.3M underwater heading into Case 10. The 6 losers absorbed $27.5M of deployment and returned only $2.5M.
What Case 10 has to do
Add Case 10’s full $10M budget. Total deployed = $63.5M. Standard funder waterfall: 2x deployed off the top, then 20% of the rest. (This is the GAO’s illustrative waterfall, which the Summersgill article cites favorably.)
| Target Portfolio Gross MOIC | Total proceeds required | Required from Case 10 (to fund) | Gross case proceeds required | Implied Case 10 MOIC (to fund) |
|---|---|---|---|---|
| 2.0x | $127.0M | $88.8M | $364.0M | 8.9x |
| 2.5x | $158.8M | $120.6M | $523.0M | 12.1x |
| 3.0x | $190.5M | $152.3M | $681.5M | 15.2x |
| 3.5x | $222.3M | $184.1M | $840.5M | 18.4x |
A 2.5x gross target — which is roughly the 2x net target most litigation finance PE funds aim for — requires Case 10 to throw off ~$523 million in collectible case proceeds. A 3.5x gross target (closer to VC) needs ~$840 million.
And this is the multiple-only view. Once you incorporate IRR — and these big cases typically take a decade to resolve — the required Case 10 proceeds roughly double. Thompson’s footnote 43 walks through a discrete-cash-flow IRR model: at a 20% portfolio IRR, the gross case proceeds rise to roughly $1 billion; at 25% IRR, roughly $1.6 billion.
The killer: appellate compression
The whole math depends on collecting $523M+ verdicts. The Heiden study (2025) tracked 82 Federal Circuit damages appeals from 2010 to 2025:
| Verdict size on appeal | % upheld |
|---|---|
| $10M+ | 38% |
| $100M+ | 30% |
| $100M+ (excluding biotech) | 10% |
| $500M+ | 0% |
Zero. Of every patent damages award over $500M that has been appealed to a final Federal Circuit decision between 2010 and 2025, none survived. The cases big enough to “carry” a 50–70% loss fund are precisely the cases that don’t survive appeal as collectible cash.
Uniloc v. Microsoft is a textbook example: $388M jury verdict, JMOL for Microsoft on non-infringement, Federal Circuit reverses on infringement but affirms a new trial on damages (verdict “fundamentally tainted by the use of a legally inadequate methodology”), eventually settles confidentially for an undisclosed (and presumably much smaller) amount. The headline number was never the collectible number.
The judgment preservation insurance (“JPI”) market briefly tried to fill the gap — VLSI’s $2.2B verdict was reportedly insured for ~$300M, itself an indication of what insurers thought the appellate-adjusted value really was. After the Fifth Circuit reversed a $1.6B judgment insured by Liberty Mutual for a reported $500–750M, the mega-verdict JPI market severely contracted. The market figured out the same thing the math says: these verdicts don’t hold.
3. Patent Damages Aren’t Startup Equity
The reason high loss rates work in actual venture is the equity tail. Sutter Hill Ventures invested less than $200M total in Snowflake. At IPO in 2020, the stake was worth ~$12.6B — roughly 63x. One outcome of that magnitude can backfill an entire fund’s losses many times over.
Patent damages don’t share that ceiling for three structural reasons:
- Statutory cap. 35 U.S.C. §284 requires damages “adequate to compensate for the infringement, but in no event less than a reasonable royalty.” Apportionment doctrine (LaserDynamics v. Quanta) further restricts a patentee to the value attributable to the patented feature, not the whole product.
- No claim on enterprise value. A patent litigation finance investment is a claim on damages from the infringement of specific patented technology. Not a percentage of the infringer. Even a billion-dollar verdict against Apple is a claim to ~$1B of damages, not a slice of Apple equity that could compound to 60x.
- Appellate compression and time. See above. Verdicts at the size required to “carry” a fund are systematically reduced or reversed.
This isn’t just a theoretical argument — Ivashkiv (2025) independently reached the same conclusion through a general theory of financial intermediation: “Because lawsuits generate finite returns, there are fewer astronomical winning bets. Without astronomical winning bets, the high-risk losing bets will drag down the entire portfolio.” Litigation funds, on his account, have “powerful incentives to look for cases that they deem strong, good cases, and then to fund them in exchange for a fairly constant multiple of invested capital.”
Plus: funders don’t even control settlement
The VC model assumes the funder can systematically force the claimant to reject a “merely large” settlement and chase the carry-the-fund outcome. In conventional litigation finance, the claimant retains settlement authority. A funder can refuse to fund continued litigation, but it can’t make the patent owner reject a $50M offer to hold out for $500M.
From the patent owner’s perspective, that $50M is life-changing. They’re not going to risk it for an outlier that primarily helps the fund’s portfolio math.
4. What the Actual Public Funder Data Looks Like
Burford Capital and Omni Bridgeway are the two largest publicly traded litigation funders. As public companies they disclose return distributions. If anyone were actually running the VC model, you’d see a high-loss, fat-tail distribution in the data. You don’t.
Loss rates
| Funder | Loss rate by capital | Loss rate by count | WilmerHale claim |
|---|---|---|---|
| Burford Capital (277 concluded / partially concluded assets through 12/31/25) | ~15% (8% adjudicated) | ~32% | 50–70% |
| Omni Bridgeway (813 completed investments through 12/31/25) | 22% (17% net of partial recoveries) | ~30% |
Even the higher Omni figure is less than half the lower bound of the WilmerHale range. And the actual capital-weighted loss rate at Burford is one quarter to one third of WilmerHale’s lower bound.
Where the returns come from
The Horsley Bridge venture data shows the top ~4.5% of dollars invested in venture-funded companies generated roughly 60% of total returns. That’s the VC “Babe Ruth” effect — a small tail does most of the work.
Omni’s portfolio looks fundamentally different. Their highest cohort (Cohort F) — investments returning 10x or above — represents 6% of deployed capital and accounts for only ~25% of total realized proceeds (≈39% of realized gains). The bulk of value comes from the moderate-return cohorts:
| Omni cohort | MOIC | Share of capital |
|---|---|---|
| Cohort A (loss) | 0.2x | 22% |
| Cohort B | 1.5x | 30% |
| Cohort C | 2.4x | 22% |
| Cohort D | 3.4x | 13% |
| Cohort E | 5–10x range | 7% |
| Cohort F (10x+) | 10.0x | 6% |
The point: strip Omni’s entire 10x+ cohort out and the remaining 94% of capital still produces a portfolio-level gross MOIC of approximately 1.9x. The portfolio doesn’t depend on the tail. That’s the opposite of a venture distribution.
Outcome type also lines up
Across Omni’s 813 completed investments:
- Settlements: 57% of deployed capital, 2.6x MOIC, 3.3-year weighted average duration, ~⅔ of total portfolio profits
- Adjudicated wins: 26% of deployed capital, 3.4x MOIC, 3.8-year duration
- Adjudicated losses: 17% of deployed capital, 0.15x MOIC (partial recoveries on losses)
Burford’s outcome data follows the same pattern: 78% of total deployments by capital resolve as settlements at ~1.7x MOIC, contributing roughly two-thirds of cumulative realized profits.
This is the opposite of a power-law distribution. It’s a steady accumulation of moderate, repeatable returns with occasional larger wins on top.
What about Burford’s patent-specific subset?
Thompson disaggregates Burford’s deal-level data to the IP vertical (46 concluded or partially concluded IP assets):
- Aggregate IP MOIC: ~1.83x
- Loss rate by count: ~35%
- None of the fully concluded IP winners exceeded the 10x VC “home run” threshold; only one exceeded 5x
The “fully concluded” IP subset looks worse on the surface (1.37x MOIC, 50% loss rate by count) — but as Thompson explains, that’s a timing artifact: losing cases close out in single events, while winning cases with multi-defendant or staged-settlement structures stay open longer in “partially concluded” status. The 20 partially concluded IP investments alone have already realized ~$293M against ~$103M deployed on the concluded portions (≈2.86x), with only one reporting a ROIC below zero.
None of this looks like a VC tail distribution. It looks like disciplined underwriting producing moderate multiples.
5. The Real Strategy: Be Picky
If the VC model doesn’t work, what do funders actually do? The data is pretty unambiguous:
| Source | Approval rate |
|---|---|
| Omni Bridgeway, historic average | 2–5% of applications funded |
| Omni Bridgeway, last fiscal year | 40 of 1,730 (≈2.3%) |
| GAO Dec 2024 report (interviews with 8 major patent funders) | “Almost all funders… said they typically fund 5 percent or fewer of the patent litigation cases that they consider” |
That’s not spray-and-pray. It’s the exact opposite: rejecting ~95–98% of opportunities and concentrating capital in high-conviction positions where the case is expected to stand on its own expected value.
This also matches what RPX has observed about funder behavior: “Given that a nonrecourse funding arrangement comes with the risk of a total loss for the investor, litigation funders spend substantial time and effort evaluating the patents for assertion.”
What This Means for Retail-Adjacent Litigation Finance
I’ve written before about the LexShares experience — a crowdfunding platform that produced a 1.25% group IRR across 42 cases over 7+ years, against a sophisticated-funder standard of >25% net IRR. The Thompson piece is essentially a structural explanation for the gap between those two outcomes.
LexShares didn’t fail because litigation finance doesn’t work. It failed because the underwriting discipline that makes the asset class work — funding fewer than 5% of cases reviewed, focusing on collectability as well as liability, building portfolios for 1.5–3.4x bands rather than chasing tails — is the opposite of what a retail-friendly, deal-velocity-maximizing platform was structurally able to do.
WilmerHale’s “VC model” attack and LexShares’ retail-platform implosion are, in a sense, two failed bets on the same wrong intuition: that high-volume, lottery-style patent investing is what’s actually being done at scale by sophisticated funders. The math says it isn’t, and the math turns out to also explain why the platforms that tried something closer to it (LexShares’ deal-velocity model on commercial cases; the briefly hot mega-verdict JPI market) ran into the same wall.
So let me steelman the critics, because I lived their version: the “VC model” isn’t a description of nothing. There’s a tier of this market — retail platforms, deal-velocity originators, the briefly hot mega-verdict insurance trade — where something close to spray-and-pray genuinely happened, and I have the 1.25% IRR to show for it. Their error isn’t inventing the pattern; it’s projecting the worst tier of the market onto the disciplined funders who are defined by avoiding exactly that behavior. And the pro-funder data deserves its own asterisk: it leans on two public funders who self-report, and the private funds that don’t disclose could be messier. I doubt they look like venture — Section II’s math binds them too — but honesty means admitting the clean dataset is small.
Where I Land
Three observations, on top of Thompson’s argument:
- The structural argument is the strongest part. Whatever you think of the policy debate around disclosure or fee-shifting, the fund math is hard to argue with: 50–70% loss rates require tail returns the patent system has never demonstrated it can produce as collectible cash. Section II of the preprint is worth reading carefully even if you skip the rest.
- The Burford and Omni data is what it is. These are the two largest public funders, with disclosure obligations a private fund can avoid. Their books look like disciplined commercial credit/specialty finance, not like venture. Two funders aren’t the whole market, but they’re the only data we have, and “three anecdotes” is a much weaker counter-sample.
- The settlement-control point quietly carries a lot of weight. Even if you imagined a fund willing to swing for the fences, the structure of conventional litigation finance puts settlement authority with the claimant — who is almost always going to take the realizable, large dollar number over the speculative jackpot. The VC analogy needs the fund to be the decision-maker, and in most arrangements it isn’t.
For me the takeaway is narrower than the policy fight. The exact discipline that makes the math work for Burford and Omni — funding under 5% of what you see, underwriting collectability, building for 1.5–3.4x bands — is precisely what I could never get as a retail investor picking cases off a platform. That’s why my litigation finance money now goes to funds run by people who reject 95% of their pipeline, not to individual cases I pick off a platform, the way I used to. Thompson set out to debunk a policy myth; along the way he also explained my portfolio.
The “VC model” framing has been useful for advocacy. It just doesn’t describe what’s actually happening.
Sources
- Sean K. Thompson, Patent Litigation Finance and the Venture Capital Myth, 27 Sedona Conf. J. ___ (forthcoming 2026) — preprint dated May 14, 2026, released under CC BY-NC 4.0
- Michael J. Summersgill, Todd Zubler, Makenzi Herbst & Nicolette Willis, The Venture Capital Model Applied to Litigation Funding: Misaligned Incentives and the Harm to Innovation, 26 Sedona Conf. J. 797 (2025) — Sedona Conference
- Bowman Heiden, The Survival of U.S. Patent Damages on Appeal: An Empirical Study of Award Size and Affirmance Rates (Sept. 21, 2025)
- Adrian Ivashkiv, Intermediation Effects in Litigation Finance, 58 Conn. L. Rev. 23 (2025)
- Burford Capital, Q4 & FY 2025 Earnings Presentation (Feb. 26, 2026)
- Burford Capital, Principal Finance Asset Data as of 12/31/2025
- Omni Bridgeway, Introduction to Omni Bridgeway (Mar. 25, 2026)
- U.S. GAO, GAO-25-107214, Intellectual Property: Information on Third-Party Funding of Patent Litigation (Dec. 2024)
- Chris Dixon, Performance Data and the “Babe Ruth” Effect in Venture Capital, Andreessen Horowitz (June 8, 2015) — Horsley Bridge data
- Ari Levy, A Low-Profile Investor Who Bet on Snowflake Eight Years Ago Is Up More Than $12 Billion After IPO Pop, CNBC (Sept. 16, 2020)
Both articles cited above are public. Thompson’s preprint is CC BY-NC 4.0. The Summersgill et al. piece is hosted openly on the Sedona Conference site.
Commentary and personal experience — not investment, legal, or tax advice. Investing carries risk, including total loss of capital. Always do your own due diligence.